
Table of Contents
Last update: June 2026. All opinions are my own.
Undergraduate thesis. Universidad Carlos III de Madrid, BBA, academic year 2020-2021, tutor Encarnación Guillamón Saorín. Final grade 9.75/10. Recipient of the INNCYBER Innovation Award (2019 and 2020). The full 51-page PDF is linked at the bottom; this is the short version.
1. The question
In 2016 Uber suffered a data breach that exposed 57 million customers. The CEO covered it up. The breach only became public a year later, after a Bloomberg investigation. In 2017 Equifax discovered an intrusion that compromised 143 million records — and waited more than forty days to tell anyone.
These are the famous cases. But every year hundreds of U.S. public companies disclose data breaches, and every year those same companies file a 10-K — the annual report that the SEC requires and that financial analysts, investors, and journalists actually read. The 10-K is mostly narrative. About 80% of a typical 10-K filing is text, not tables. And the text is unregulated in form: the SEC says you have to file one, but it doesn't tell you what tone to use, how readable it has to be, or how much ambiguity is allowed.
So the question is: when a company has just been hacked, does the language of its 10-K reflect that — clearly, prominently, transparently? Or does management use the freedom of the narrative to cover up?
This thesis is the empirical answer to that question.
2. The data
I built the sample from the Privacy Rights Clearinghouse (PRC), a non-profit that aggregates U.S. data-breach disclosures from press releases, government notifications, and security-state breach-notification laws. From the PRC's 9,015 breach records between 2005 and 2019, I kept only incidents that compromised more than 1,000 records (4,400 incidents — this filter excludes outlier-tiny incidents that wouldn't realistically affect a firm's disclosure behaviour) and that came from public, for-profit, U.S.-listed companies (3,837 private/government/non-profit organisations dropped out).
That left names — and matching company names to Compustat (the standard financial-data warehouse) is harder than it sounds. Firms change names. Subsidiaries roll up to parents. Compustat tracks firms by GVKEY, which can split across mergers. I used Excel's Fuzzy Lookup add-in for the first pass and then manually verified every match: walking the SEC EDGAR registry to find historical names, treating unlisted subsidiaries as inheriting the parent's GVKEY, and cross-checking against CRSP for stock-return continuity.
The final cleaned sample:
- 645 breach incidents
- 511 unique firm-year breaches (a firm with multiple breaches in one fiscal year is treated as one event)
- 359 unique firms breached over 15 years
- 29,481 firm-year control observations from the same industries (4-digit SIC) over the same period
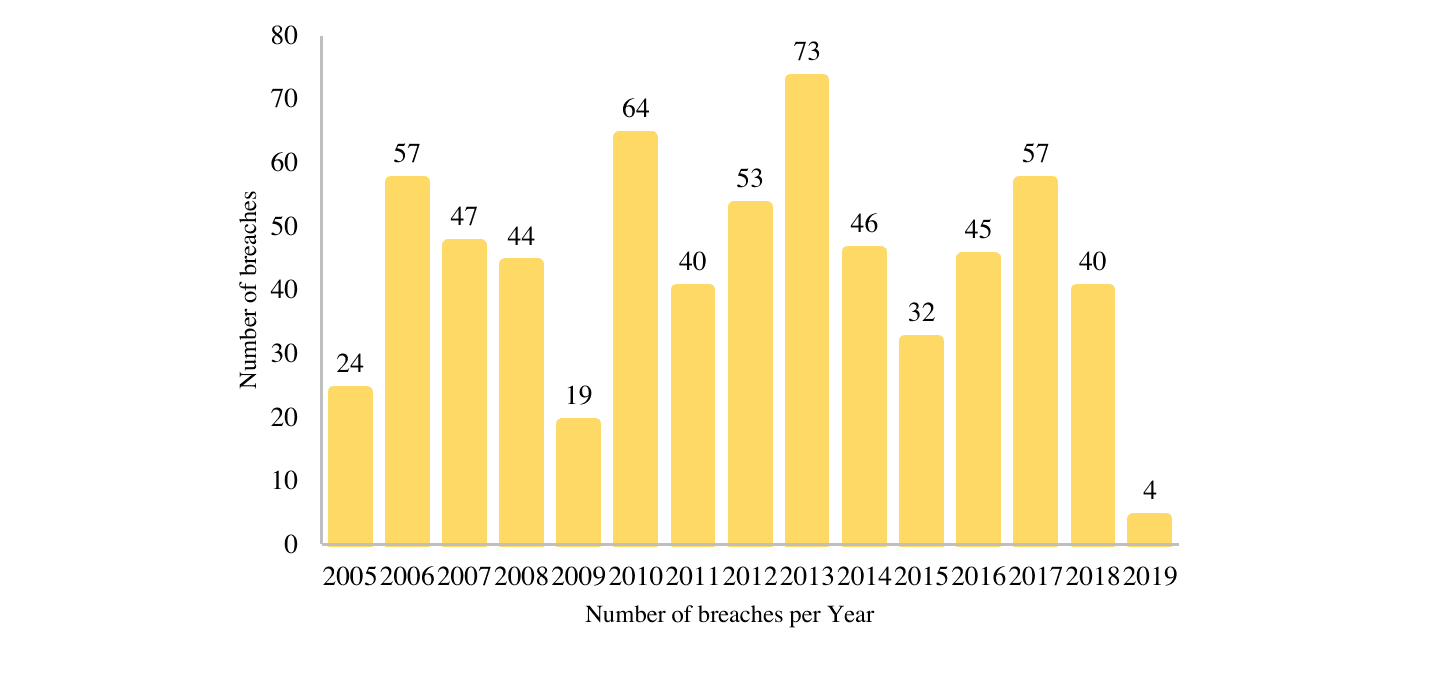
The peak in 2013 is real — it's the year of the Target breach, Snapchat, and a wave of retail-sector compromises. The trough in 2019 is an artefact: PRC publishes breaches with a lag, so the final year of the sample is under-counted. The 2009 dip matches reporting from Digital Guardian — fewer breaches that year but each one was much larger.
Industry breakdown of the 642 matched incidents (Fama-French 12-industry classification):
| Industry | Breaches | Share |
|---|---|---|
| Finance | 243 | 38% |
| Business Equipment | 105 | 16% |
| Wholesale, Retail | 72 | 11% |
| Healthcare, Medical, Drugs | 58 | 9% |
| Telephone & Television | 31 | 5% |
| Other | 133 | 21% |
Finance and tech dominate — which is roughly what you'd expect from "companies with a huge number of customer records sitting in a database somewhere".
3. Who actually gets breached?
Before asking what breached companies say, the thesis first asks what they are. Compared to non-breached firms in the same industries, breached firms are:
- Bigger — total assets one standard deviation higher
- Older — 7 years older on average (24 vs 17)
- Higher-valued — Tobin's Q higher
- More likely audited by Big 4 — 95% vs 67%
- More likely in the Fortune 500 — 14% vs 3%
- Less likely to be loss-making — 11% vs 27%
In other words: the more visible you are, the more likely you are to get hacked. That's not random — high-visibility firms are valuable targets and have more data to steal.
A logit regression confirmed the direction (Fortune 500, log assets, ROA, growth all enter positively significant), but the headline number is the R² without fixed effects: 0.03. That is to say: even the firm-level characteristics that predict breaches explain almost none of the variance in which firms get breached in which year. Whether you get hacked in a given year is, statistically speaking, mostly noise — an exogenous shock. That's important, because the rest of the analysis treats the breach as an exogenous event in a difference-in-differences design.
4. The cost of a breach
The thesis pauses here to verify that data breaches are, in fact, costly — because if they're not, there's nothing for management to cover up. Using a difference-in-differences specification with industry-by-year and firm fixed effects:
| Outcome | Year 0–1 | Year 0–2 | Year 0–3 |
|---|---|---|---|
| Market-to-book (M/B) drop | −0.58 (***) | −0.53 (***) | −0.48 (***) |
| Price-to-earnings (P/E) drop | −1.5 to −2.0 (*) | −2.6 to −3.1 (**) | −3.1 to −3.5 (***) |
| Return on equity (ROE) | small | mostly flat | mixed |
The M/B drop of ~0.54 is about 10% of the cross-firm standard deviation of M/B in the sample. The P/E decline grows over time and persists for at least three years. So breaches damage long-run firm value far more than they damage short-run earnings — i.e., it's the market's future expectations that take the hit, not so much the current-year P&L. That's the financial backdrop. Management knows this. The thesis then asks what they do with their pen.
5. The three things narratives can do
Following the financial-linguistics literature (Loughran & McDonald 2011; Huang et al. 2014; Li 2010; Bonsall, Leone et al. 2017), there are three orthogonal levers a manager has when writing a 10-K narrative:
| Lever | What it measures | How to detect it |
|---|---|---|
| Tone | Optimism vs pessimism | Count positive vs negative words from the Loughran-McDonald 2011 finance dictionary (254 positive + 2,329 negative). TONE = (pos − neg) / total |
| Vague language | Hedging, ambiguity, lack of commitment | Count uncertainty words (approximate, contingent, depend) and weak modal words (might, could, maybe, possibly) |
| Complexity | How hard the report is to read | Log of the file size of the 10-K, plus the Bog Index (Bonsall et al. 2017) — a plain-English readability score combining sentence-bog and word-bog measures |
The three are independent. A report can be optimistic and vague (lots of hopeful generalities). Or pessimistic and clear (a frank admission). Or optimistic and long (drown the bad news in volume). Each combination tells a different story about what management is trying to do.
The first analytic move is to construct abnormal tone — the tone that can't be explained by the firm's actual economic fundamentals.
# Following Huang et al. (2014)
# Regress raw TONE on the economic fundamentals that would
# justify being optimistic or pessimistic in a given year:
tone_model <- lm(TONE ~ EARN + RET + delta_EARN + SIZE + BTM +
                        STD_RET + STD_EARN + AGE + BUSEG + GEOSEG + LOSS,
                 data = panel_2000_2018)
# The residual is "abnormal tone" — the optimism that isn't explained
# by the underlying numbers. It's what's left after stripping out
# justifiable cheer.
panel$ABTONE <- residuals(tone_model)
If a firm's abnormal tone is positive, the language is rosier than the fundamentals warrant. The thesis then validates this by testing whether ABTONE predicts future earnings and cash flows. It does — and the coefficient is negative:
Firms with abnormally optimistic tone today have worse cash flows and earnings 1, 2, and 3 years out (Table 10: ABTONE coefficient on future CFO is −0.47, −0.67, −0.78, all p < 0.01). This is the smoking-gun: optimism that isn't backed by fundamentals isn't a signal — it's misdirection.
That validates the measure. With ABTONE in hand, the three hypotheses follow:
- H1: After a breach, firms use a more optimistic (abnormal) tone.
- H2: After a breach, firms use more vague language to hide behind ambiguity.
- H3: After a breach, firms write longer, more complex 10-Ks.
The empirical model is a difference-in-differences specification with Post indicators that capture the year of the breach (Post0), the year of the breach plus the previous year (Post0-1), two years (Post0-2), three (Post0-3), and four (Post0-4). All regressions include industry-by-year fixed effects so the comparison is within-industry, within-year between breached and non-breached firms.
6. H1 — Tone shifts up
The cleanest result in the thesis.
| Window | Δ Tone | Δ Abnormal Tone |
|---|---|---|
| Year of breach (Post0) | +13% | +8% |
| Year of breach + previous year (Post0-1) | +9% | +5% |
| Plus two years (Post0-2) | +7% | +3% |
| Plus three years (Post0-3) | +6% | n.s. |
| Plus four years (Post0-4) | +6% | n.s. |
All numbers (***) significant for the windows shown without "n.s." Coefficients are from regressions on the controls Huang et al. (2014) used to construct abnormal tone.
The effect is strongest in the year of the breach itself and fades over time, which is exactly what you'd expect if managers are managing the moment. By year 3 or 4 post-breach, raw tone is still elevated, but the abnormal component (the optimism that isn't justified by fundamentals) has decayed back to noise.
The most defensible single sentence in the thesis: breached firms write a 10-K narrative that is 8% more abnormally optimistic in the year they got hacked than they would have otherwise written — even after controlling for the firm's actual earnings, returns, size, growth, volatility, age, business and geographic segments, and discretionary accruals.
7. H2 — Vagueness goes DOWN (the surprise)
I went into this expecting breached firms to hide behind vague language — more might, could, approximate, depending. The opposite is true.
| Window | Uncertainty words (UNC) | Weak modal words (POSS) |
|---|---|---|
| Year of breach (Post0) | n.s. | −0.018% (*) |
| Year + previous year (Post0-1) | n.s. | −0.016% (**) |
| Plus two years (Post0-2) | −0.023% (*) | −0.015% (**) |
| Plus three years (Post0-3) | −0.026% (*) | −0.019% (***) |
| Plus four years (Post0-4) | −0.027% (**) | −0.022% (***) |
The reduction is small in absolute terms (~10–20% of one standard deviation of these features) but statistically significant across the multi-year windows for both measures.
The interpretation that fits the data: breached firms don't hide behind ambiguity. They project authority. They strip out the mights and coulds and possiblys, replace them with confident assertions, and let the reader assume the firm has it all under control. That's a much more sophisticated form of obfuscation than hedging — it's the opposite of hedging.
This is one of the contributions I'm most proud of: the prevailing literature predicted vagueness would increase after a bad event (the "hide-behind-ambiguity" thesis). The data says no. They get more declarative, not less.
8. H3 — Reports get longer
Confirmed cleanly, and the effect grows over time:
| Window | Δ ln(file size) | Δ Bog Index |
|---|---|---|
| Year of breach (Post0) | n.s. | n.s. |
| Year + previous year (Post0-1) | +1.4% (*) | +0.38 |
| Plus two years (Post0-2) | +1.8% (***) | +0.52 (**) |
| Plus three years (Post0-3) | +1.7% (***) | +0.63 (***) |
| Plus four years (Post0-4) | +1.6% (***) | +0.75 (***) |
ln(file size) is the log of the 10-K's net byte count (after stripping HTML). A 1.7% increase in log file size compounded over four years is a 10-K that's about 7% longer than its industry peers — and substantially less readable per the Bog Index.
The pattern looks like: in the immediate post-breach 10-K, length and complexity don't move much. The footprint of the breach is small. But over the following three to four years, the breached firm's 10-K steadily grows and becomes harder to read, relative to the same firm before the breach and relative to peers who weren't breached. The longer-run obfuscation strategy isn't tone-management — it's volume-management. Drown the bad news in pages.
9. Putting it together
The three findings line up into a coherent story:
After a data breach, U.S. public firms write 10-K narratives that are more optimistic, less ambiguous, and progressively longer — a pattern consistent with managerial opportunism (Verrecchia 1983; Dye 1985; Huang et al. 2014). The breach itself is the bad news; the words are the cover.
What makes the finding non-trivial:
-
Identification. The breach is treated as an exogenous shock (the logit's R² without fixed effects is 0.03 — firm characteristics barely predict who gets breached when). The DiD compares breached firms to industry-year peers, with firm fixed effects in robustness checks. That rules out most of the "selection on observables" alternative explanations.
-
The vagueness flip. Prior literature predicted breached firms would hedge. They don't. The thesis adds a wrinkle that other text-disclosure studies missed.
-
The validation step. The
ABTONEmeasure is shown to predict negative future earnings and cash flows — so the optimism isn't insider information being shared early. It's misdirection. -
The economic-significance check. The matched-pair analysis (breached firms vs nearest-neighbour peers) confirms the same direction. The result isn't an artefact of the control sample.
10. Why this matters
A few audiences should care.
-
Investors and analysts. If you read a 10-K from a firm that's had a breach in the last 3–4 years, you should be reading it with an awareness that the document is, on average, longer than it would have been otherwise, more confident than the fundamentals warrant, and more positive in tone than is justified by the firm's actual earnings. The numbers section is mandated; the narrative section is editorial — and the editorial choices are statistically biased toward making the firm look better than it is.
-
Regulators. The U.S. doesn't have a comprehensive federal data-breach disclosure law (unlike the EU's GDPR). The SEC's 2011 and 2018 cybersecurity guidelines are non-binding. This thesis is empirical evidence that voluntary disclosure of breach consequences in narrative form is systematically biased — which is a quiet argument for mandatory, structured breach disclosure.
-
Practitioners working with 10-K text. The Loughran-McDonald 2011 dictionary, the Bog Index, and the Huang abnormal-tone construction all work. They're cheap. They scale. If you have a corpus of 10-Ks and an event date, you can run this analysis on a new event class (M&A, layoffs, accounting restatements, executive turnover) in an afternoon.
11. What I'd do next
- Granular breach data. The PRC database is a binary indicator: there was a breach or there wasn't. The actual press releases say what was stolen, how it was stolen, and what the company plans to do. Text-mining those announcements would let you separate "lost credit-card numbers" from "lost intellectual property" — two breaches with very different implications.
- Beyond the 10-K. Earnings press releases (more discretionary), 8-K filings (more timely), and earnings-call transcripts (conversational, harder to manage) would tell a complementary story.
- Market reaction. This thesis doesn't directly tie the linguistic shifts to stock-price reactions. With event-study returns layered on top, you could ask whether the market prices in the obfuscation. If it doesn't — if optimistic post-breach 10-Ks earn the same returns as honest ones — that's a profitable trading strategy lying around.
- Modern text models. The Loughran-McDonald dictionary is bag-of-words. Transformer-based models (e.g., FinBERT, fine-tuned on 10-Ks) could pick up subtler shifts in framing, hedging, and topic that the dictionary misses.